market_report
6.1 Market
Slide 1 - Cover (LAVisions layout)layout: title_hero · 16:9
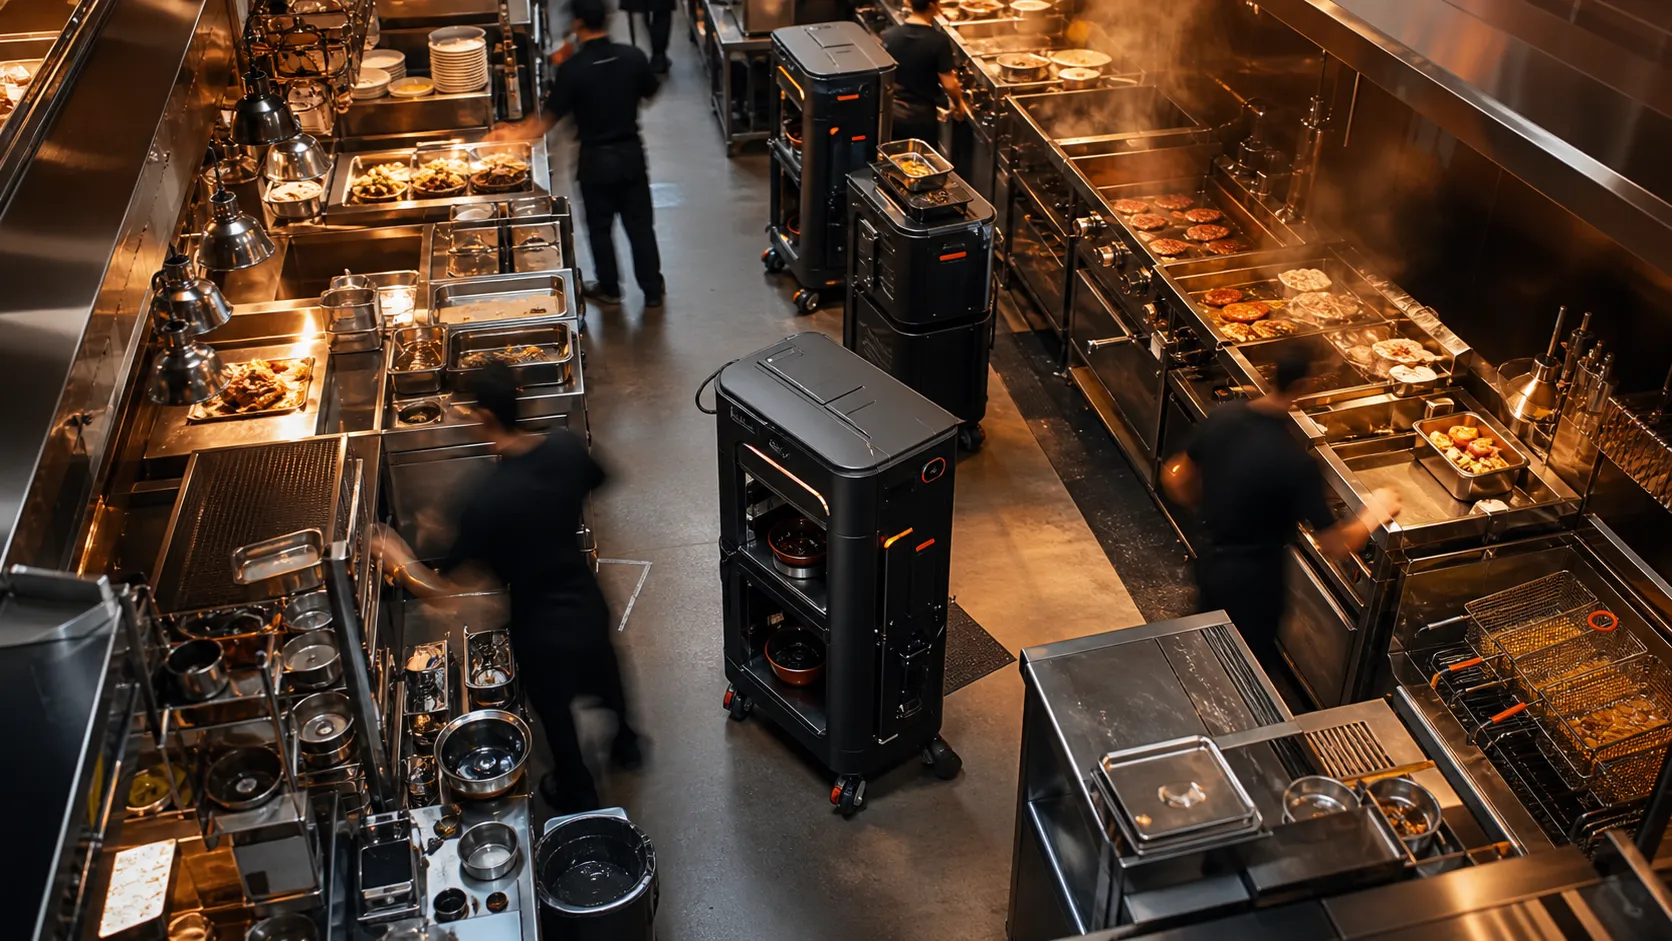
Market Opportunity Report
Forge
Why kitchen labor is the breaking constraint of US fast-casual today
Market Opportunity
Market Trends
Labor shortage compounding
180,000 line-cook positions unfilled across US fast-casual, openings growing eight percent year over year.
NRA State of the Industry 2025
Wage inflation eats margin
Average line-cook wages up 28 percent since 2021 across major US metros; restaurant labor as percent of revenue at all-time high.
BLS Occupational Employment Statistics 2025
Manipulation hardware cost collapse
Six-axis arm hardware down 47 percent since 2020; vision plus ML stack now cheap enough for restaurant-margin economics.
ARK Invest Big Ideas 2026
Market Size
Serviceable Obtainable Market
$2.1B
Forge internal estimate, 2026 — top-100 fast-casual chain coverage analysis
Business Model
Robot-as-a-Service
Primary Source of Income
Subscription at six thousand dollars per cell per month on twenty-four month contracts, all-in, no hardware capex on the operator.Additional Sources of Income
Recipe OS recipe-licensing revenue once chain library expands past 50 chains. Per-cell installation fee of three thousand dollars. Technomic Foodservice Tech Report, 2025
Revenue per Cell
One cell equals one self-contained robotic cooking unit on a twenty-four month Robot-as-a-Service contract, billed monthly.
$72,000
Plus 65% gross margin per cell at scale, with hardware service, software, and remote operations bundled into the subscription.
Total Addressable Market
$920B
Bottom-up by store economics
Total addressable market = Stores x Replaceable cooks per store x Loaded labor per cook
Buyer-by-chain-size: three segments matching United States fast-casual chain procurement archetypes. Segment 1 = regional chains (5-50 stores), Segment 2 = national chains (100-500 stores), Segment 3 = top-tier national chains (500+ stores). Together these cover every fast-casual operator with the line-cook headcount and balance-sheet capacity to sign a Robot-as-a-Service contract. Residual $882B represents broader restaurant industry spend (food cost, rent, front-of-house labor, beverage, full-service and quick-service formats outside fast-casual) not addressable by the cell directly, retained in the headline because the published National Restaurant Association figure encompasses total industry revenue.
How Forge wins regional chains store by store, then unlocks national
5.8% CAGR (2025-2030), source: National Restaurant Association Industry Forecast 2025, cross-checked against Bureau of Labor Statistics loaded-labor inflation
Bottom-up from Technomic Top 500 store counts cross-checked with Bureau of Labor Statistics line-cook wage and headcount data.
Regional fast-casual chains (5-50 stores)
Cells deployed
180K
Months active
4
Revenue per cell-month
$42,000
$30.2B
National fast-casual chains (100-500 stores)
Cells deployed
32K
Months active
4
Revenue per cell-month
$45,000
$5.8B
Top-tier national chains (500+ stores)
Cells deployed
10K
Months active
4
Revenue per cell-month
$50,000
$2.0B
Serviceable Addressable Market
$38B
SAM funnel: $38B × 60% × 70% × 85% × 35% = $4.8B serviceable obtainable opportunity
Filters applied to TAM:
Chain scale: 5+ stores with centralised procurement
Single-store independents lack HQ procurement and the volume to justify a cell deployment. 5+ store chains cover roughly 60% of US fast-casual labor spend.
Cuisine fit: wok, pasta, and grill formats Forge ships today
Forge cells handle these three formats in production at pilot chains. Excludes pizza, sushi, salad, and frying-only menus until those cell formats ship; covers about 70% of fast-casual cuisine mix.
Kitchen infrastructure: 240V power and an open 50 sq ft footprint
Standard service kitchens in fast-casual carry 240V single-phase service and adequate floor area. About 85% of target chain stores qualify without retrofit; the remaining 15% need an electrical upgrade Forge would underwrite.
Buyer access: HQ-procured ops decisions (not franchise-level)
Equipment selection runs through corporate ops at company-owned or HQ-mandated stores. Excludes franchisee-discretionary purchases. Roughly 35% of qualifying stores fall inside HQ-procured estates.
TAM
$920B
SAM
$38B
Serviceable Obtainable Market
Our target in 5 years
$2.1B
| Year | Cells deployed | Months active | Revenue per cell-month | Total |
|---|---|---|---|---|
| Y1 | 12 | 12 | $3,750 | $540K |
| Y2 | 45 | Why a purpose-built cell beats every retrofit and every workaround | $3,800 | $2.05M |
| Y3 | 140 | 12 | $3,964 | $6.66M |
| Y4 | 350 | 12 | $4,200 | $17.64M |
| Y5 | 700 | 12 | $4,500 | $37.80M |
New cells per year
Active cells (year-end)
Industry Growth and CAGR
5.8% CAGR through 2030
Growth Trends
Line-cook labor cost up 28% since 2021 (BLS) | https://www.bls.gov/oes/
Foodservice robotics funding hit $1.2B in 2024 (PitchBook) | https://pitchbook.com/
Fast-casual sales reached $145B in 2024, up 9% (Technomic) | https://www.technomic.com/
Line-cook turnover sits at 75% annually (NRA Workforce) | https://restaurant.org/
CAGR Growth
Market Challenges
Four real barriers keep automation out of kitchens, and each one is a Forge edge.
Kitchen footprint constraints
Retrofit arms inherit kitchen chaos and add 6-9 month integration cycles.
Forge ships a self-contained cell that drops in over one closed shift.
Operator capex sensitivity
Restaurant operators run on thin margins and reject $70K hardware purchases.
Robot-as-a-Service at $6,000 per month sits in the labor line, not capex.
Menu and recipe variability
Cuisine-locked arms force chains to pick one format and rebuild.
Forge prices below the labor cost it replaces; payback in month one, no capex on the operator balance sheet
Recipe complexity drift
One bad service kills a chain pilot. Uptime is non-negotiable.
Forge logs 98% uptime over two production quarters with 24/7 remote operations.
Key Takeaway
Large, labor-starved, capex-allergic, ready for Forge.
Total Addressable Market
$920B
Serviceable Addressable Market
$38B
Serviceable Obtainable Market
$2.1B
Compound Annual Growth Rate
5.80%